
Your stakeholders don’t want a 40-page data dump. They want a roadmap to growth. If you’re still spending 20 hours a month on manual data entry, you’re falling behind the 61% of marketers who see AI as the biggest industry shift in decades. It’s time to stop the “so what?” questions. Start delivering clarity instead. Using a high-performance marketing reporting template for stakeholders turns your raw analytics into a persuasive engine for executive buy-in.
We understand the struggle of proving that creative video production actually moves the needle. It’s often difficult to link brand building to hard ROI without a clear framework. You need a streamlined process that highlights your wins and justifies larger budgets. This article reveals the 2026 strategic framework for reporting. You’ll learn how to visualize brand growth, automate tedious tasks, and master the art of stakeholder communication. Let’s turn your data into your greatest competitive advantage.
Key Takeaways
- Stop the data dump and learn how to pivot from reporting raw clicks to showcasing revenue growth that captures stakeholder attention instantly.
- Master the 2026 strategic framework to build a marketing reporting template for stakeholders that translates complex analytics into clear business outcomes.
- Discover the secrets to tailoring your reports for different audiences, ensuring your CEO sees the growth while your manager sees the tactical efficiency.
- Streamline your workflow by auditing your data sources and choosing the right visualization tools to eliminate manual entry forever.
- Explore how an integrated approach linking video production and ad performance creates a unified view of your brand’s total market impact.
Why Most Marketing Reports Fail the Stakeholder Test
Data alone is a distraction. Most marketers deliver a 40-page deck and wonder why their budget gets cut. It’s because they’ve built a data dump, not a strategic narrative. Stakeholders don’t care about your CTR if the bottom line is flat. They want a reporting style that mirrors core marketing principles by connecting activity directly to growth. If your report doesn’t offer context, it creates confusion instead of confidence.
We’ve entered the era of the “Metric Trap.” Reporting on clicks or impressions is easy; proving revenue is hard. In 2026, looking backward is a death sentence for your department. Your marketing reporting template for stakeholders must shift from “what happened” to “what happens next.” You need to distinguish between operational dashboards and stakeholder presentations. One tracks the engine for your team. The other shows the board where the car is going. Implementing a professional marketing reporting template for stakeholders ensures your message never gets lost in the noise.
The Gap Between Data and Decision-Making
Your CEO ignores that 50-page SEO report because it doesn’t speak the language of profit. Technical jargon like “crawl budget” or “backlink profiles” doesn’t drive executive decisions. You must translate these concepts into business outcomes. Identify the “One Metric That Matters” for your audience. Whether it’s market share or customer lifetime value, focus your narrative there. Clear communication wins budgets. Complex jargon loses them.
The Cost of Inefficient Reporting
Manual reporting is a silent killer of creative momentum. When your team spends 20+ hours a month copy-pasting numbers into spreadsheets, they aren’t building your brand. They’re acting like expensive data entry clerks. This manual grind also invites human error. One broken cell in a non-templated spreadsheet can tank an entire quarter’s strategy. Moving from data entry to strategic analysis is how you scale. It allows your team to focus on high-impact work, like partnering with a video production agency to drive engagement, rather than fighting with formatting. Efficiency isn’t just about saving time; it’s about reclaiming your team’s strategic power.
The 2026 Framework: Essential Components of a Strategic Reporting Template
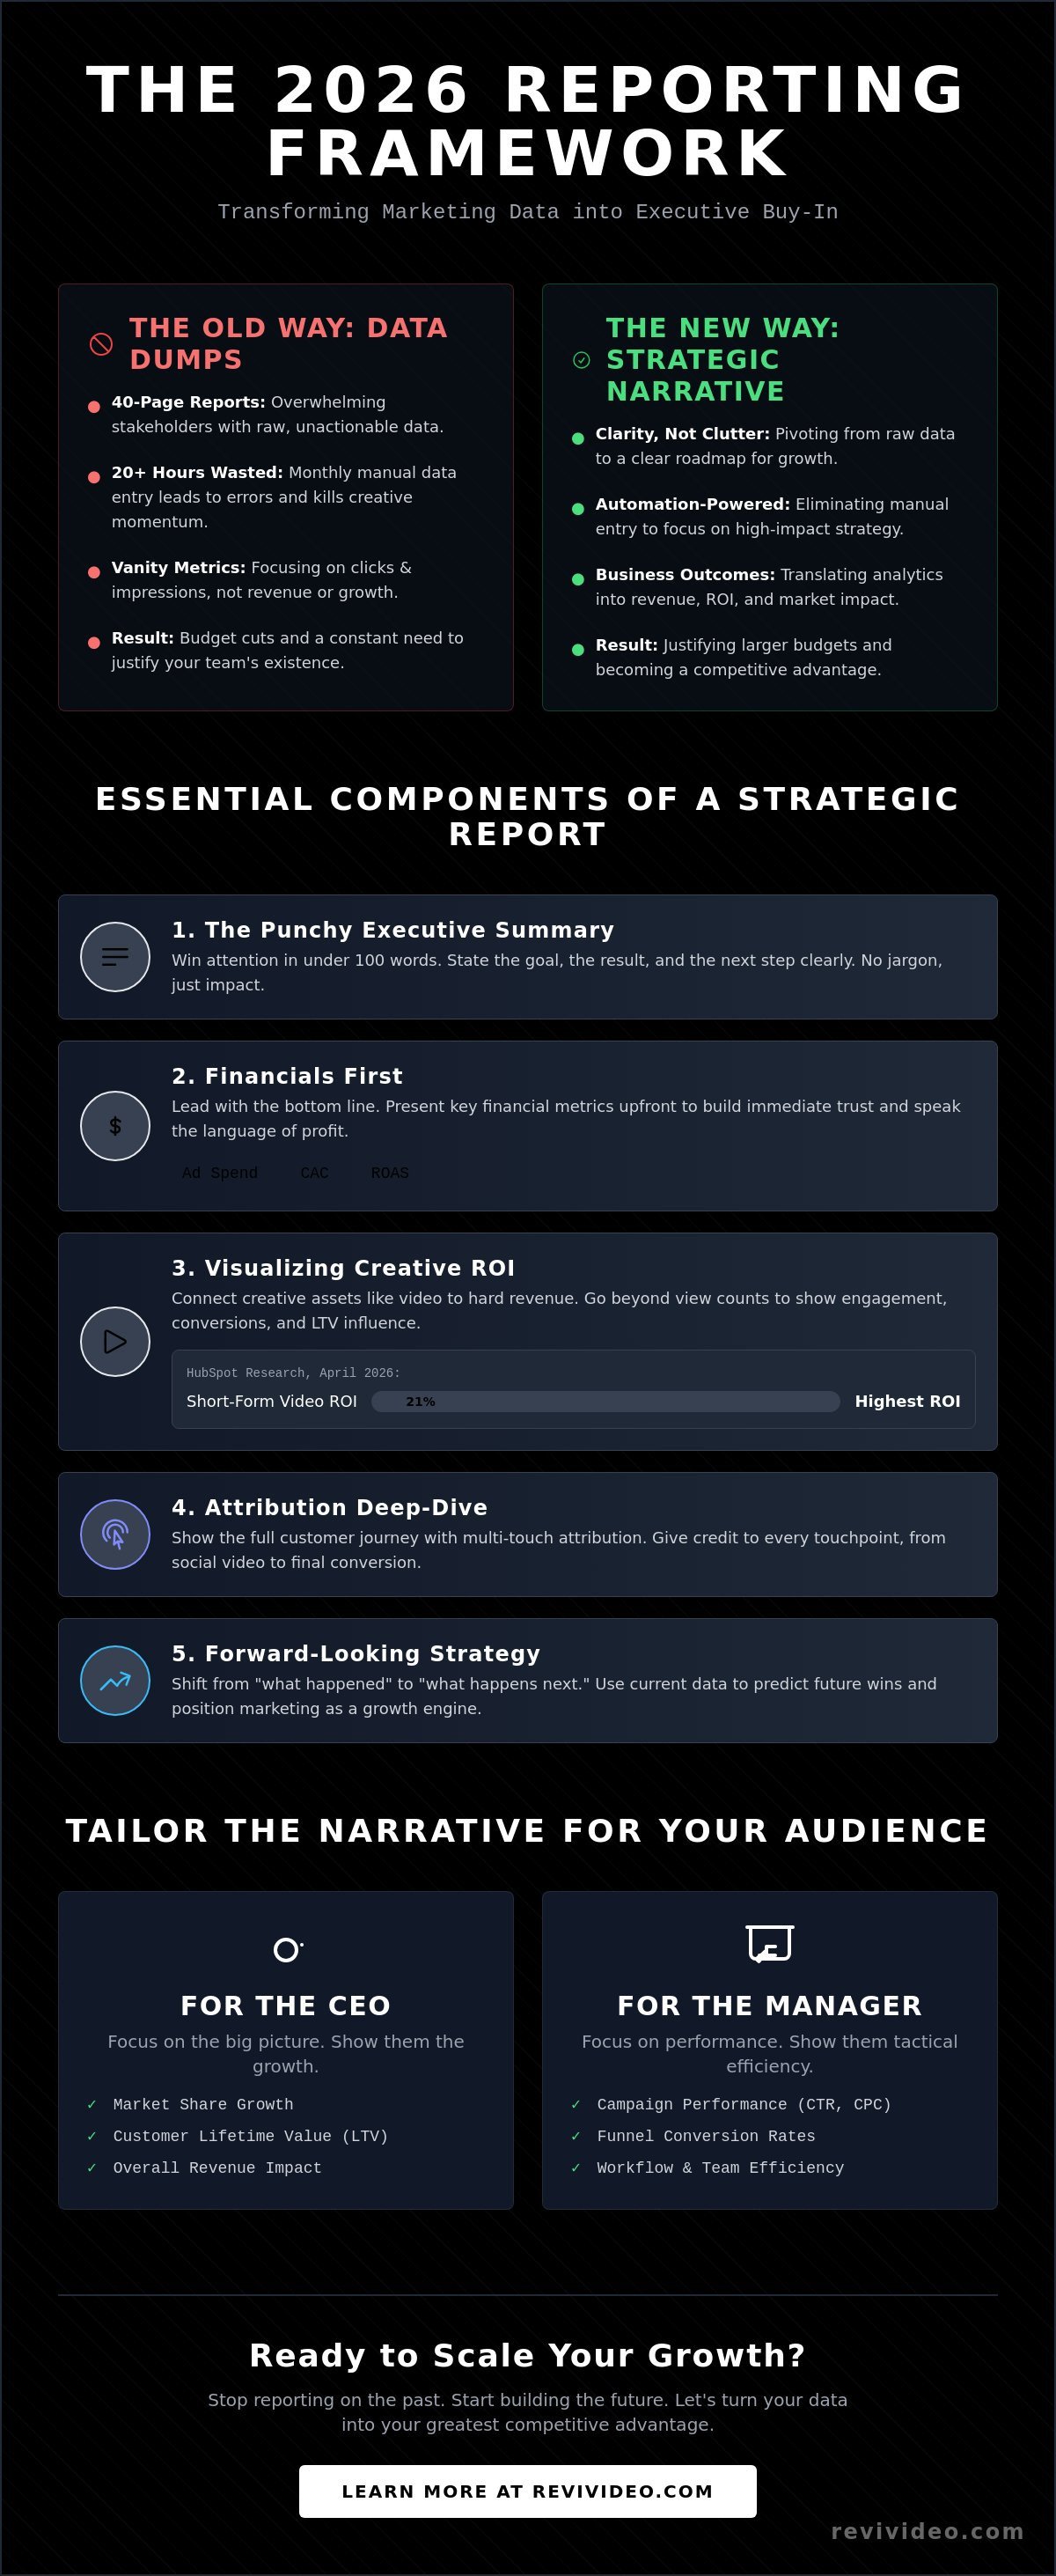
The 2026 framework isn’t about looking back. It’s about showing the path forward. A modern marketing reporting template for stakeholders starts with a punchy Executive Summary. Win their attention in 100 words or less. State the goal, the result, and the next step. Then, hit the financials hard. Stakeholders need to see ad spend, Customer Acquisition Cost (CAC), and Return on Ad Spend (ROAS) without digging through tabs. This clarity builds immediate trust.
When reporting to senior executives, you must prove creative impact. Video isn’t just a “nice to have” anymore. It’s a high-octane performance driver. Your marketing reporting template for stakeholders should bridge the gap between creative assets and hard revenue. Finally, close with a forward-looking strategy. Use current data to predict next month’s wins. This turns your report into a business growth engine rather than a historical archive.
Visualizing Creative ROI
Measuring video production impact requires looking past simple view counts. Focus on engagement rates versus actual conversions. Brand building directly influences long-term customer lifetime value (LTV). Use heatmaps and website stats to justify custom development needs. HubSpot research from April 2026 shows that 21% of marketers find short-form video delivers the highest ROI. Showing this connection in your report secures your creative budget. If you want to see how elite creative drives these numbers, check out the results-driven work at REVI.
The Attribution Deep-Dive
Multi-touch attribution gives credit where it’s due. You need to track the journey from a viral social video to a final website conversion. This isn’t just about the last click. It’s about understanding every touchpoint. In 2026, attribution modeling must balance user privacy with data accuracy by utilizing anonymized aggregate signals and first-party data to map the customer journey without violating state-level compliance laws. This approach ensures you stay compliant while still proving the value of your top-of-funnel brand building efforts.
Executive vs. Operational: Tailoring Your Template for Different Audiences
One size fits nobody. If you hand the same report to your CEO and your social media manager, you’ve already lost. A high-performance marketing reporting template for stakeholders must be modular. It needs to pivot from high-level growth metrics to granular tactical wins in seconds. Your leadership team wants to see how you’re capturing market share. Your operational team needs to know which ad set is burning cash. Tailoring the view ensures that every person in the room stays engaged and informed.
The CEO Report demands brevity. Focus on the bottom line and long-term impact. Show them how your brand building efforts translate into hard revenue. If you’re targeting specific regions, like the Phoenix-Scottsdale corridor, highlight your local market penetration. Local stakeholders care about dominating their backyard. Frequency is the final piece of the puzzle. Use weekly pulse checks to keep momentum high. Reserve the monthly deep dives for strategic pivots and long-term planning. This cadence keeps everyone aligned without causing meeting fatigue.
The High-Level Executive Deck
Limit this deck to 5-7 high-impact slides. Executives don’t have time for fluff. Focus on Brand Authority and Market Share as your primary pillars. This is where you prove that your identity is evolving. Working with a top-tier branding agency can help you articulate this growth. Show the visual evolution of your brand alongside rising trust scores. This slide isn’t just about aesthetics; it’s about competitive dominance and perceived value in a crowded market.
The Channel-Specific Deep Dive
This is the engine room of your marketing reporting template for stakeholders. For PPC and Ad Buying, prioritize transparency. Show exactly where the money goes and how targeting has shifted to improve ROAS. Website performance should focus on technical health and UX conversion rates. If the site is slow, your ad spend is wasted. Finally, treat social media engagement as a precursor to brand trust. High engagement today means lower acquisition costs tomorrow. Keep these reports tactical and action-oriented to drive immediate improvements.
Building Your Template: From Data Extraction to Visual Storytelling
Building a marketing reporting template for stakeholders is a high-stakes engineering project. It isn’t just about making charts look professional. It’s about constructing a reliable pipeline that moves data from your tech stack to the boardroom with zero friction. Start with a hard audit of your data sources. Connect your CRM, Google Analytics, and ad platforms into a unified view. This prevents the “conflicting numbers” trap that destroys executive trust. When your data sources don’t match, your strategy loses its foundation.
Pick your visualization tool based on your team’s speed and scale. Looker Studio offers rapid deployment and easy sharing for most modern brands. PowerBI handles massive enterprise datasets with deep complexity. Custom dashboards provide the ultimate flexibility for unique business models that standard tools can’t map. Once the plumbing is ready, define your KPIs based on specific business goals. Forget industry averages. They’re a distraction and a race to the middle. Focus on the metrics that actually drive your valuation and market share. This ensures your marketing reporting template for stakeholders stays locked on growth.
Refine your template based on direct stakeholder feedback. If your CEO keeps asking about a specific metric, move it to the first slide. If they skip the social engagement stats, move them to the appendix. Your report should evolve as the business scales. This iterative approach turns a static document into a living strategic asset. It ensures you’re always answering the questions that matter most to the people holding the budget.
Automation: The Efficiency Shortcut
Manual data entry is a relic of the past that kills creative momentum. Use APIs to pull real-time performance metrics directly from your ad buying platforms. This ensures your reports are always current and error-free. Set up automated alerts for significant performance shifts. If your conversion rate drops or your lead cost spikes, you need to know instantly. In 2026, AI tools can even draft the first version of your executive summary. They identify trends and anomalies in seconds. This allows you to spend your time on high-level narrative rather than basic data assembly.
Designing for Clarity
Visual storytelling requires extreme discipline. Apply the “3-Second Rule” to every chart and graph. If a stakeholder can’t grasp the core insight in three seconds, the visual is too complex. Use bold color and high contrast to highlight wins and warnings. Green signifies momentum while red signals a need for tactical adjustment. Keep your slides lean. Less is always more in a high-stakes deck. A clean, focused design reflects a clear, confident strategy. If you want to transform your reporting into a growth engine, start with a strategic audit from REVI.
Scaling Your Growth with REVI: Beyond the Template
A static template is only the beginning. While a marketing reporting template for stakeholders provides the structure you need, scaling requires a partner who can act on the insights. REVI bridges the gap between raw data and creative execution. We don’t just hand you a deck; we optimize the engine. By integrating your video, web performance, and ad buying into a single, unified view, we eliminate the blind spots that plague traditional reporting. This ensures your strategy stays agile and your growth stays consistent.
Most agencies keep their creative and analytical teams in separate rooms. At REVI, we tear those walls down. Having a video production agency manage your reporting ensures that your creative strategy stays data-backed. We see exactly which frames drive engagement and which assets fall flat. This creates a feedback loop where creative production and ad performance work in perfect harmony. When we link your video production metrics directly to your ad buying performance, we see the “why” behind the “what.” Your marketing reporting template for stakeholders becomes a roadmap for continuous improvement, not just a monthly chore.
Our custom reporting reflects your unique brand identity, ensuring that every deck you present reinforces your authority. We turn insights into rapid campaign optimization, moving faster than the market to secure your growth. This proactive approach means we aren’t just reporting on what happened last month. We are predicting what will work next week. We focus on the high-impact moves that increase your market share and lower your acquisition costs.
Local Expertise, Global Results
Phoenix and Scottsdale brands face unique competitive pressures. You need a partner who understands the local landscape while delivering world-class results. We help local businesses dominate their niche by identifying specific market trends and audience behaviors. Our reporting provides the clarity you need to outpace competitors in the Valley. REVI’s reporting serves as the ultimate shortcut to a professional-grade digital presence by translating complex local data into actionable growth strategies.
Get Started with Strategic Reporting
Stop guessing and start growing. A custom reporting audit reveals the hidden opportunities in your current tech stack. Our integrated team of video and ad specialists uses these insights to drive measurable ROI. Don’t let your data sit idle in a spreadsheet. Turn it into a competitive weapon that wins executive buy-in and captures market share. Elevate your reporting with REVI today and see the difference that a results-driven partnership makes for your brand.
Own Your Growth Narrative
Reporting isn’t a chore; it’s your most powerful tool for securing executive buy-in and bigger budgets. You’ve learned how to ditch the 40-page data dump for a strategic narrative that speaks the language of revenue. By tailoring your marketing reporting template for stakeholders to specific audiences and automating the manual grind, you reclaim the time needed for high-impact creative work. The 2026 framework ensures your data always points toward the next strategic win rather than just looking at the past.
Execution is where the market winners are decided. REVI provides the full-service expertise you need across ad buying, video production, and website development to ensure your reports always show upward momentum. We specialize in helping Phoenix and Scottsdale brands dominate their local markets with results-driven reporting that justifies every dollar of spend. You deserve a partner that treats your growth as the ultimate benchmark of success. Stop guessing and start growing; partner with REVI for data-driven results. Your brand’s potential is limitless when your data and your creative are perfectly aligned.
Frequently Asked Questions
What is the best format for a marketing report for stakeholders?
A concise, visual slide deck is the premier format for executive communication. It forces you to distill complex data into a clear narrative. A professional marketing reporting template for stakeholders should prioritize high-impact visuals and executive summaries over dense spreadsheets. This approach ensures your message lands in seconds. Use bold charts to highlight growth and keep the technical details in the appendix.
How often should I present marketing reports to my C-suite?
Present comprehensive strategic reports monthly, but provide high-level pulse checks weekly. Monthly deep dives allow for strategic pivots based on significant data trends. Weekly updates keep the leadership team aligned on momentum without overwhelming them with long meetings. This cadence ensures total transparency while respecting executive schedules. It keeps your team agile and responsive to market shifts.
What are the top 5 KPIs to include in a marketing reporting template?
Prioritize Customer Acquisition Cost (CAC), Return on Ad Spend (ROAS), Customer Lifetime Value (LTV), Market Share, and Revenue Growth. These five metrics tell the true story of your marketing efficiency. Avoid vanity metrics like raw reach or impressions. Every metric in your marketing reporting template for stakeholders must link back to a business goal. This focus turns your report into a growth engine.
How can I measure the ROI of brand-building and video production?
Track engagement rates as a precursor to trust and monitor long-term LTV growth. Use multi-touch attribution to see how video assets influence the customer journey before the final click. Brand building is a long-term play that lowers future acquisition costs. Compare conversion rates of users who watched a video versus those who didn’t to see immediate impact. This proves the value of creative assets.
What is the difference between a marketing dashboard and a report?
A dashboard is a real-time tracking tool for daily operations, while a report is a curated narrative for strategic decision-making. Dashboards show what is happening right now. Reports explain why it happened and what you will do next. Stakeholders need the context of a report to justify budget increases. Use dashboards for your team and reports for your leadership.
How do I explain a dip in marketing performance to stakeholders?
Address performance dips with immediate data and a proactive solution. Identify the root cause, whether it’s a seasonal shift or a platform algorithm change. Don’t mask the numbers. Explain exactly how you are pivoting to reclaim momentum. Stakeholders value honesty and a clear plan of action. Transparency during a dip often builds more long-term confidence than a perfect quarter.
Can I automate my marketing reporting without expensive software?
Yes, use free tools like Looker Studio combined with native platform connectors and APIs. You can pull real-time data from ad platforms and CRMs without a massive tech budget. Automation removes the manual entry burden and eliminates human error. It allows your team to focus on strategic analysis rather than data formatting. Speed up your workflow without breaking the bank.
Should I include competitor data in my stakeholder reports?
Include competitor benchmarking only when it provides actionable context for your own performance. Show how your market share or share of voice compares to industry leaders. This helps stakeholders understand your brand’s relative position. Use this data to justify aggressive ad buying or brand building strategies in crowded niches. Contextual data turns a simple report into a competitive strategy.